Usage and costs
The Usage page shows what each endpoint cost and when, by hour or by day for up to 90 days, with a CSV download; bitsrun usage shows the same in the terminal.
Usage shows where your credit went: which endpoint ran, for how long, on which GPU, and what it cost.
The overview
The Overview page is the first thing you see after signing in. It shows your balance and how long it lasts at this week's pace, what you spent this month and today, the last 24 hours hour by hour, and how many endpoints are running now.
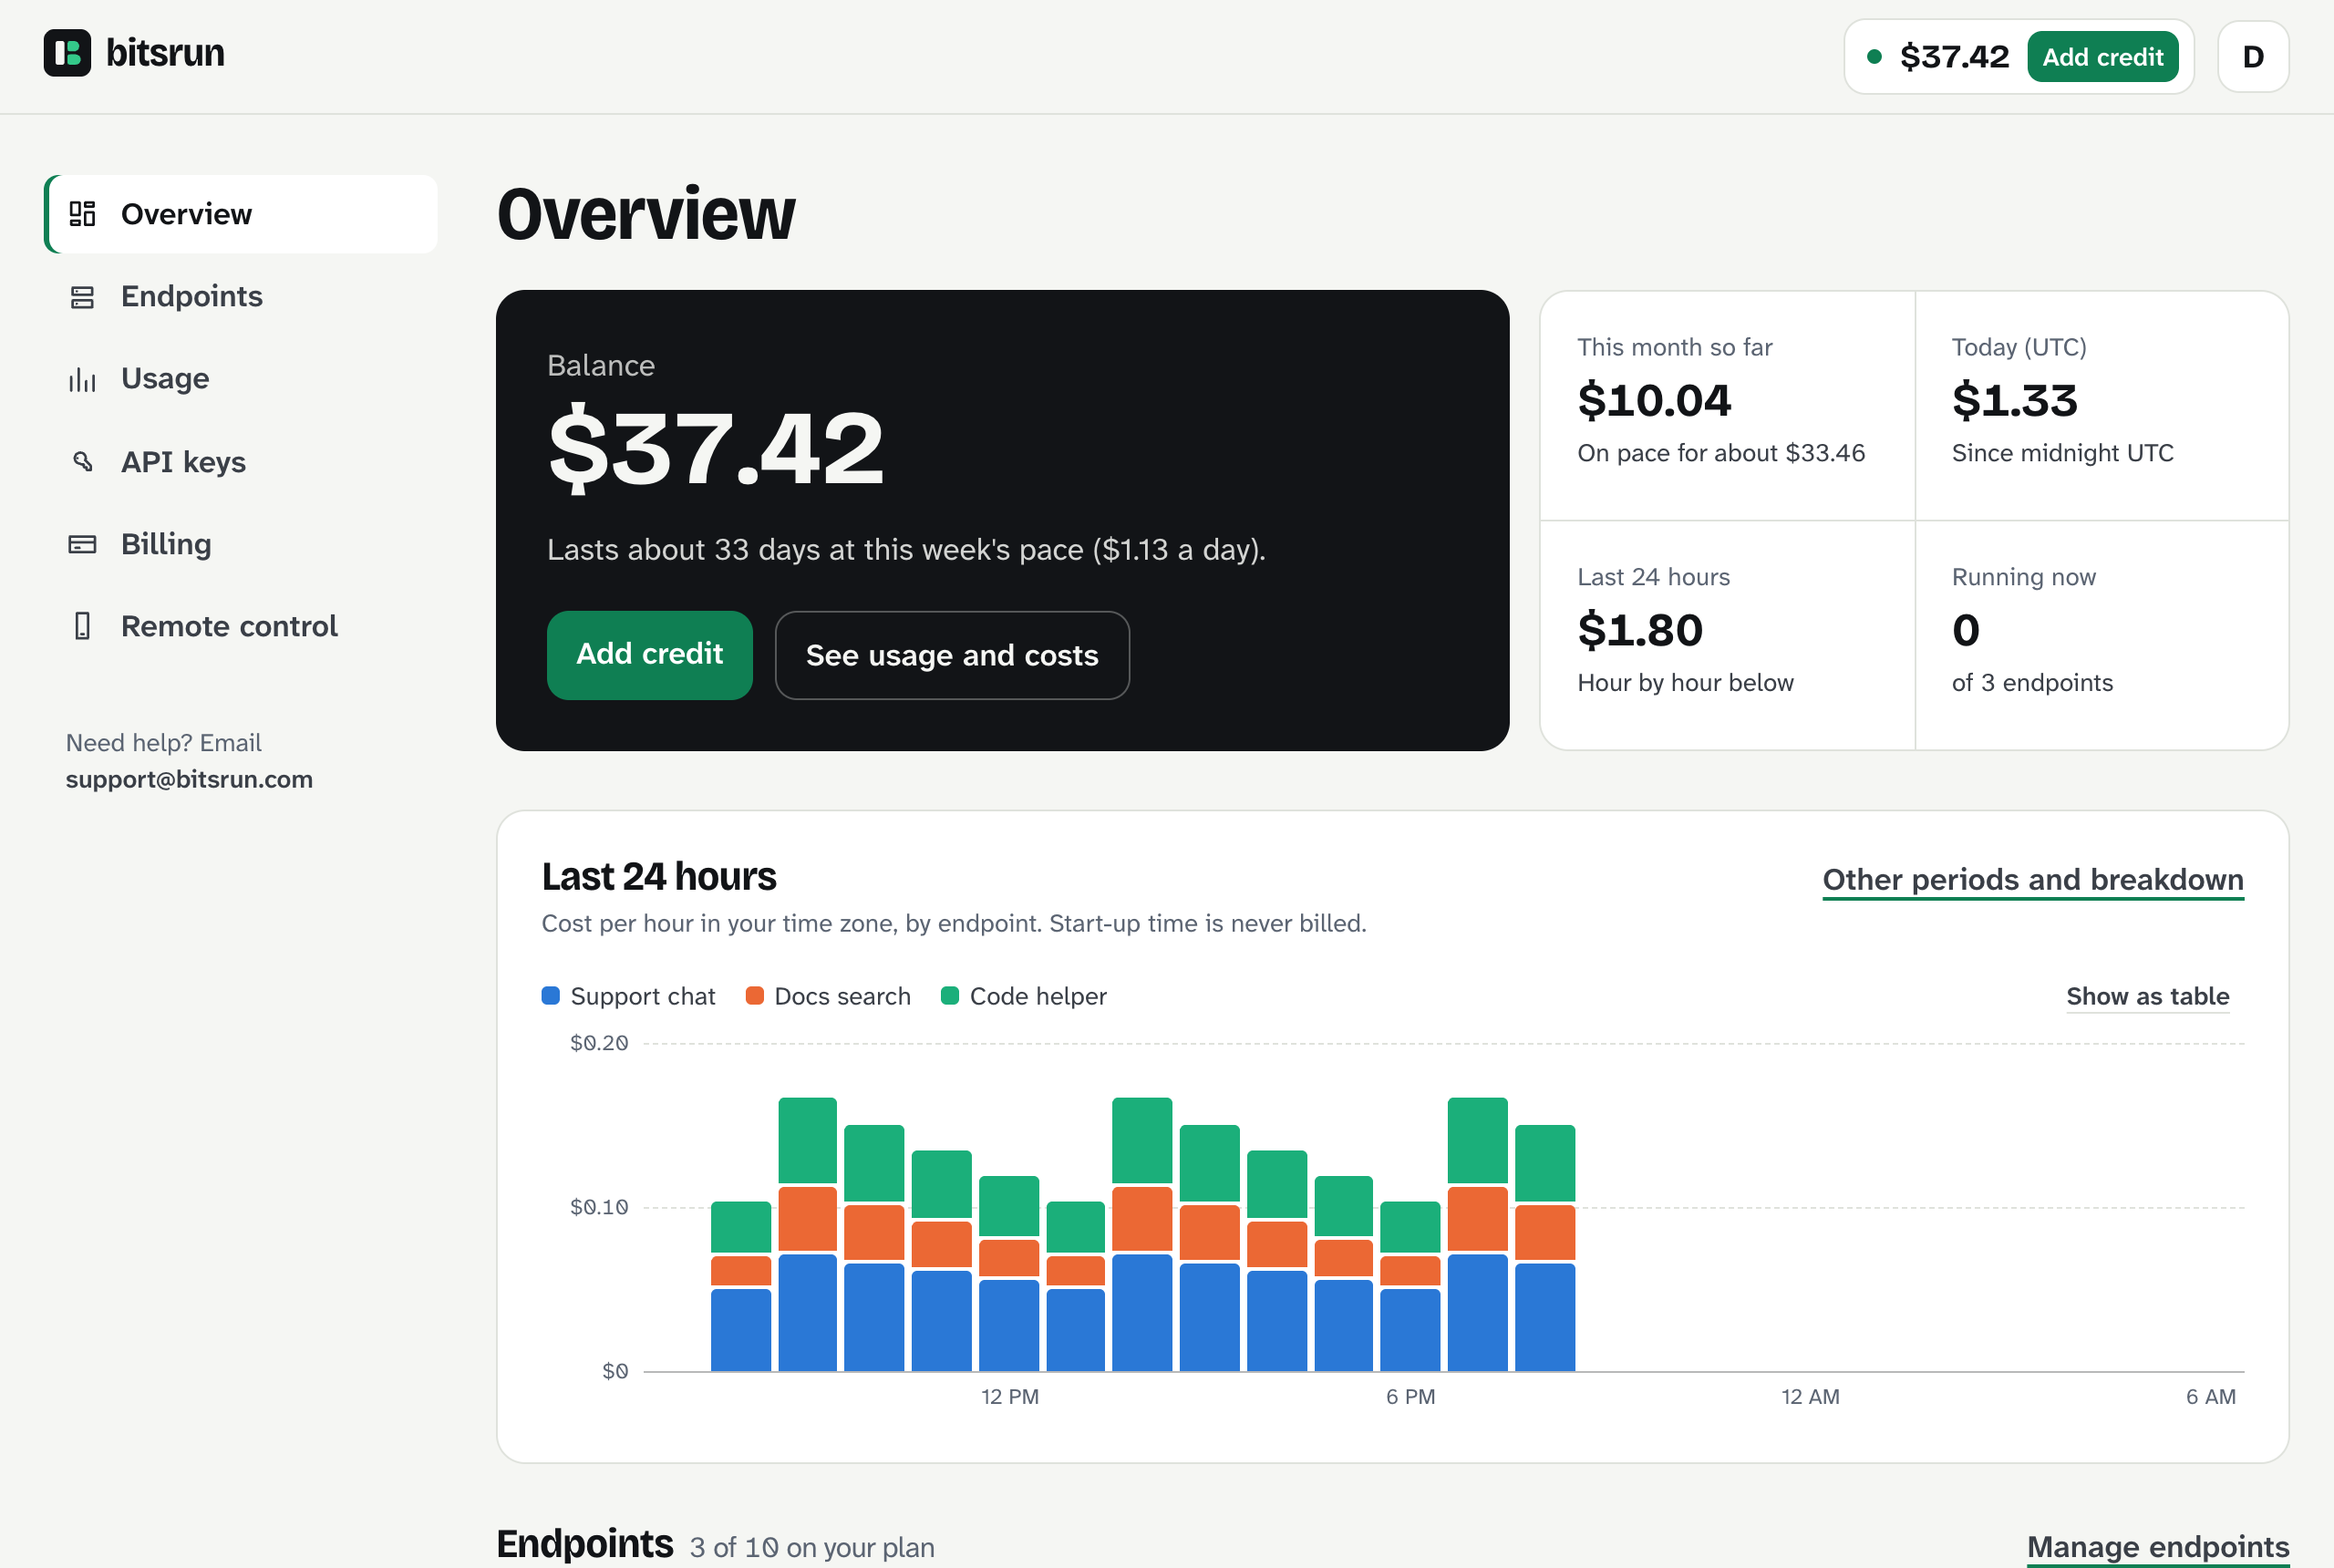
Days are counted midnight to midnight UTC. Hour-by-hour charts use your time zone.
The Usage page
Open Usage in the sidebar, or select See usage and costs on the Overview.
- Pick a period: 24 hours, 7 days, This month, 30 days or 90 days.
- Read the totals at the top: total cost, GPU time billed, average per hour and the busiest hour.
- Read the chart: cost per hour (short periods) or per day (longer periods), one color per endpoint. Select Show as table to read the numbers instead.
- Read the breakdowns:
- By endpoint: cost and running time of each endpoint, largest first.
- By kind: GPU time and model storage.
- By GPU size: time and cost on each GPU.
- Select Download CSV to get the numbers in a spreadsheet.
Sleeping and start-up time never appear, because they are never billed.
In the terminal
bitsrun usageshows running time and cost for this month. Pick dates with --from and --to, and add --json for scripts:
bitsrun usage --from 2026-10-01 --to 2026-10-31 --jsonSpot unexpected costs
- An endpoint never sleeps: a client may be sending requests in a loop, or a health check may call it every minute. Check the hourly chart for a flat line, and check which keys can reach that endpoint.
- Always-on is on: always-on endpoints are billed every second, even with no requests. Turn it off in the endpoint's settings if you do not need it.
- A long sleep setting: a 1-hour Sleep after keeps the GPU for up to an hour after each request. A few minutes is enough for most apps.
- Unknown traffic: revoke any key you do not recognize. See API keys.
What can go wrong
- "No GPU time in this period.": nothing ran in the chosen period. Pick a longer period.
- Today's numbers look low: an endpoint that is awake right now keeps adding seconds until it sleeps. The Overview refreshes every minute; reload Usage to see the latest numbers.
Still stuck?
Email support@bitsrun.com with what you tried and any request id you saw. A real person answers.